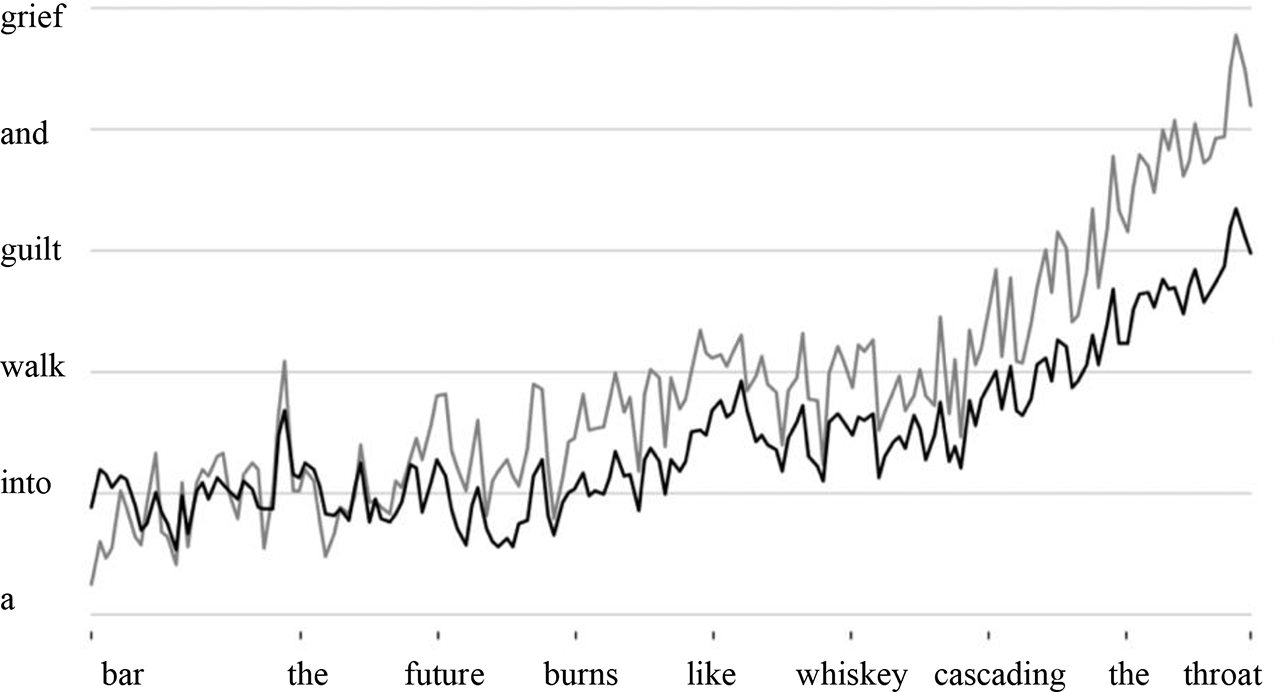
– Featuring a graph from the 2019 IPCC Special Report on Climate Change and Land. The graph represents observed changes in surface air temperature over land and changes in global (land-ocean) mean surface temperature relative to the pre-industrial period (1850-1900).


